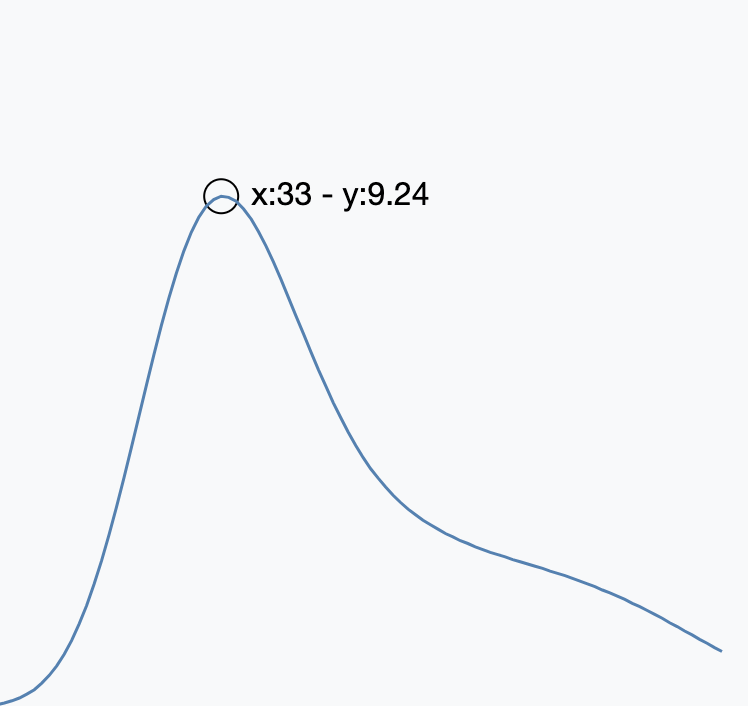
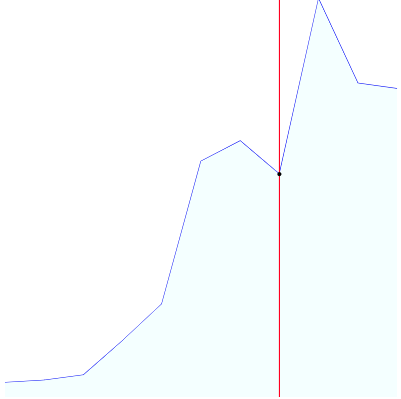
0. 목표
-
마우스 포인터 기준으로, 해당 포지션의 **데이터(차트)**를 보여주자


1. 데이터를 표현할 Tag를 만들어주자
const $line = document.createElementNS('http://www.w3.org/2000/svg', 'line')
const $spot = document.createElementNS(
    'http://www.w3.org/2000/svg',
    'circle'
)
2. lineChart의 Path(X, Y좌표)를 이용하자
- 기존 데이터를 사용하는 대신, **lineChart를 그린 데이터(비율로 계산)**의 좌표를 활용
- 비율대로 계산된 데이터(X, Y 좌표)
===마우스 포인터의 위치(X, Y 좌표)const dataPoints = [] data.forEach((value, index) => { const x = index * offset const y = getY(max, height, strokeWidth, value) pathCoords += `L ${x} ${y},` // element의 너비와 높이 비율에 따라 계산된 좌표를 넣어준다. dataPoints.push({ x, y }) })
- 비율대로 계산된 데이터(X, Y 좌표)
3. Mouse(Touch)의 위치
-
Mouse Event(offset)
- event를 binding한 element부터 현재 포인트의 위치를 알 수 있다.
const handleMouseMove = (e) => { const position = { x: e.offsetX, y: e.offsetY, } draw(position) } -
Touch Event(touchs.client, getBoundingClientRect)
- touch 이벤트의 touches property와 getBoundingClientRect를 활용
const handleTouchMove = (e) => {
    const rect = svg.getBoundingClientRect()
    const position = {
        x: e.touches[0].clientX - rect.left,
        y: e.touches[0].clientY - rect.top,
    }
    draw(position)
}
3. mouse position을 가지고, 가장 가까운 좌표를 찾는다.
- mouse position보다 큰 좌표(chart Line) 좌표를 찾는다
- 만약 없다면, 마지막 좌표라고 가정한다.
- 1번에서 찾은 데이터로, 이전 좌표(chart Line)를 찾는다.
- 찾은 좌표들을 활용하여, 더 가까운곳을 Target 좌표라고 가정한다.
- 3번 데이터가 없다면, 첫번째 데이터라고 가정한다.
- Target 좌표를 가지고 포인터와 라인 Tag를 그려준다.
const draw = (position) => { // datapoint에서 가장 가까운것을 찾는다 let nextDataPoint = dataPoints.find((entry) => entry.x >= position.x) // undefined라면 마지막 데이터이다. if (!nextDataPoint) { nextDataPoint = dataPoints[lastItemIndex] } // 이전 데이터 위치를 찾는다. const previousDataPoint = dataPoints[dataPoints.indexOf(nextDataPoint) - 1] let currentDataPoint if (previousDataPoint) { // 2번과 3번과의 데이터를 가지고 데이터의 중간 위치를 구한다. const halfway = previousDataPoint.x + (nextDataPoint.x - previousDataPoint.x) / 2 // 중간 위치보다 크다면, 2번 데이터; 없다면, 3번 데이터를 현재 데이터라고 가정한다. currentDataPoint = position.x >= halfway ? nextDataPoint : previousDataPoint } else { // 이전 데이터가 없다면, 첫번째 데이터라고 생각한다. currentDataPoint = nextDataPoint } const xChord = currentDataPoint.x const yChord = currentDataPoint.y // 선그리기 $line.setAttribute('x1', xChord) $line.setAttribute('x2', xChord) $line.setAttribute('y1', 0) $line.setAttribute('y2', svgHeight) // 포인터 $spot.setAttribute('cx', xChord) $spot.setAttribute('cy', xChord) $spot.setAttribute('r', sporRadios) } - 기존 데이터를 사용하는 대신, **lineChart를 그린 데이터(비율로 계산)**의 좌표를 활용
4. D3 라이브러리를 활용하면, 간단하게 한줄로 바꿀수 있다.
- D3란? interactive 데이터시각화(차트, 그래프)를 구현하기 위한 라이브러리
Jquery같이 Dom에 접근해서 요소를 핸들링(생성, 및 속성 변경), 속성을 바꾸는 역할- 주요한 역할은 아래와 같이, 계산부분을 이용하여, 차트나 그래프를 그리기에 유용!
// mouse event
const handleMouseMove = (e) => {
    const [x, y] = d3.pointer(e)
    draw({ x, y })
}

// touch event
const handleTouchMove = (e) => {
    const touches = e.touches[0]
    const [x, y] = d3.pointer(touches)
    return { x, y }
}

const draw = ({ x }) => {
    // 해당 포인터의 위치 찾기
    const i = d3.bisectCenter(xCoords, xScale.invert(x))
}
5. 배포하기
나만 쓰기 아깝고... 누군가... 필요할것같고??... 자랑하고 싶어서...
-
npm회원가입(이메일 확인! 꼭! 확인하자.. 이것때문에 10분 날림)
-
package.json 수정
- private으로 배포하는게 아니기 때문에, publishConfig를 public으로 설정
- 만약 private로 사용하고 싶다면, 가격은 7$/month (등록 방법)
{ "name": "react-svg-spark-line", "version": "1.0.3", "description": "Simple SVG SparkLine React component", "main": "dist/index.js", "private": false, "module": "dist/index.js", "publishConfig": { "access": "public" }, "bugs": { "url": "https://github.com/kode15333/sparklinechart/issues" }, "homepage": "https://github.com/kode15333/sparklinechart#readme", } - private으로 배포하는게 아니기 때문에, publishConfig를 public으로 설정
-
tsconfig.json 수정
- include - Transpilers path
- noEmit 은 분명히 true로 설정되있을땐데 무조건 false로 바꿔줘야한다. 안되면 트랜스파일링 된 파일이 나오지 않는다.
{ "compilerOptions": { "target": "es6", "module": "es6", "lib": [ "dom", "es2015" ], }, "include": [ "./src/lib/*" ], "exclude": [ "node_modules", "**/*.spec.ts", "./dist/**/*" ] } -
tsc명령어로 트랜스컴파일!!- 두가지 형태로 나온다. 하나는 타입스크립트 전용 하나는 일반 리엑트 컴포넌트
dist ├── SparkChart │ ├── index.d.ts │ ├── index.js │ ├── types.d.ts │ ├── types.js │ ├── useWindowSize.d.ts │ ├── useWindowSize.js │ ├── util.d.ts │ └── util.js ├── index.d.ts └── index.js -
npm 배포
-
결과물