Chrome, React는 다 만들어놈... 잘 사용하기만 하면 된다.
자주 쓰는 console API에 대해서
-
dir
- 기능 및 역할 : Object의 속성을 트리의 형태로 보여준다
- log와의 차이점
- log의 경우, toString() 값을 보여주고, dir은 tree의 형태로 보여준다.
- document.body 인자로 넣어보면, log ⇒ HTML tree의 형태, dir ⇒ JSON.tree
// log vs dir > console.log(/foo/); /foo/ > console.dir(/foo/); /foo/ global: false ignoreCase: false lastIndex: 0 .. > console.log(new Date()) Sun Feb 13 2022 18:33:35 GMT+0900 (한국 표준시) > console.dir(new Date()) > Sun Feb 13 2022 18:33:35 GMT+0900 (한국 표준시) constructor getDate() .. -
trace
- 기능 및 역할 : 호출한 곳의 stack trace를 보여준다.
function foo() {
    function bar() {
        console.trace()
    }
    bar()
}

foo()

/*
bar
foo
<anonymous>
*/
Debugger Statement (in Chrome)
Runtime 중 해당 문을 실행시키면, 해당 컨텍스트에 접근할 수 있다.(like breakPoint)
Chrome은 다 만들어놨다...
1. Chrome Debugger Button

-
Resume Script Execution(Command +
\)- 역할 : 스크립트를 재실행하며, 다음 breakPoint 만나면 멈추게 된다.
-
Step over (Command +
')-
역할 : 해당 함수의 컨텍스트를 넘어가고 다음 라인으로 넘어간다
-
flow: A(stop) → (B , C skip) → B(stop)
function updateHeader() {
    var day = new Date().getDay()
    debugger
    var name = getName() // A
    updateName(name) // D
}
function getName() {
    var name = app.first + ' ' + app.last // B
    return name // C
}
-
-
Step into (Command +
;)-
역할 : 해당 함수의 컨텍스트로 넘어간다.
-
flow : A(stop) → B(stop)
function updateHeader() {
    var day = new Date().getDay()
    debugger
    var name = getName() // A
    updateName(name)
}
function getName() {
    var name = app.first + ' ' + app.last // B
    return name
}
-
-
Step out (Command + Shift +
;)-
역할: 해당 함수를 실행후, 다음 컨텍스트로 넘어간다.
-
flow: A(stop) → (B Skip) → C(stop)
function updateHeader() {
    var day = new Date().getDay()
    var name = getName()
    updateName(name) // C
}
function getName() {
    debugger
    var name = app.first + ' ' + app.last // A
    return name // B
}
-
-
Step(F9) : line by line 으로 이동한다.
-
Deactivate BreakPoint (Command + F8 ): Skip BreakPoint
-
Don’t Pause / Pause on Exception
- 역할: Exception이 발생하는 곳에서 해당 스크립트를 멈출 수 있다.
2. Chorme Debugger pannel
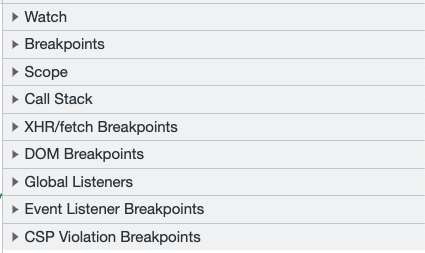
- Watch : 원하는 변수를 등록하여, 함수가 실행시 어떻게 변하는지 확인할 수 있다.
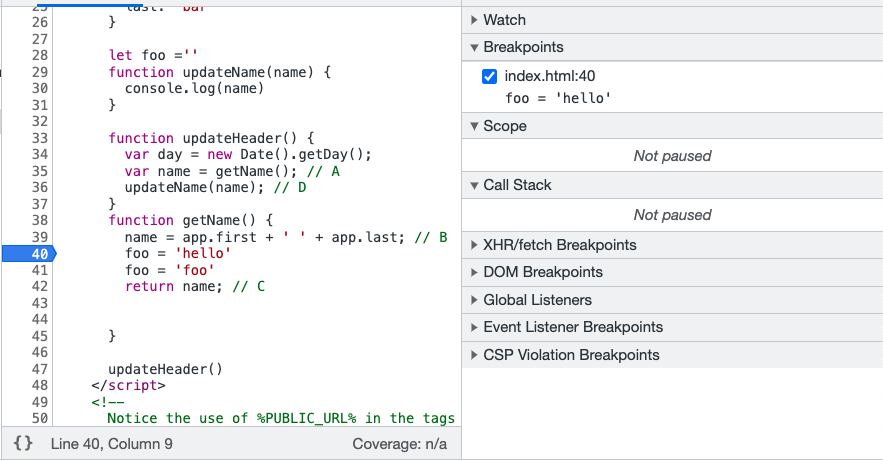
- BreakPoints: 현재 지정한 BreakPoint를 확인할 수 있다.
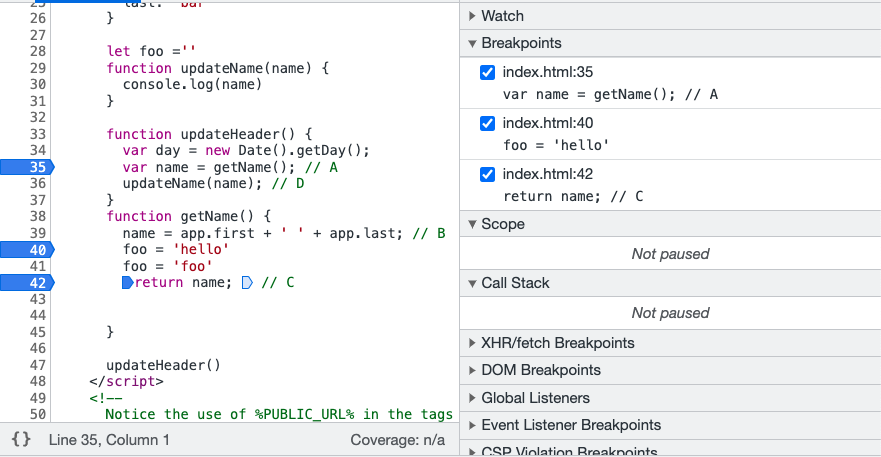
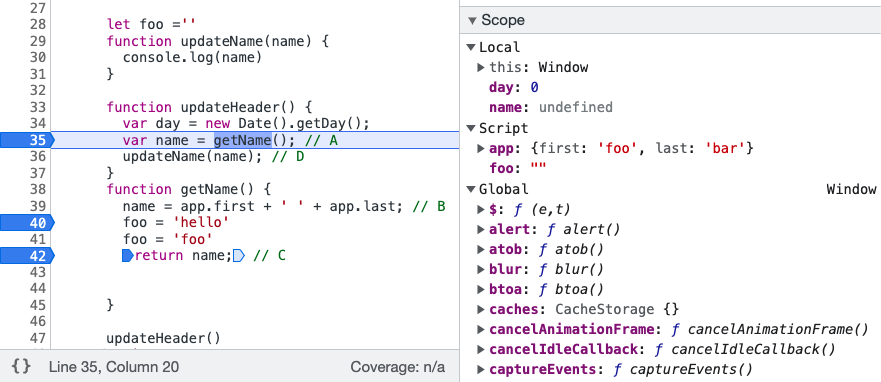
- Scope : 해당 변수의 Local / Script / Global Scope의 변수영역을 보여준다.
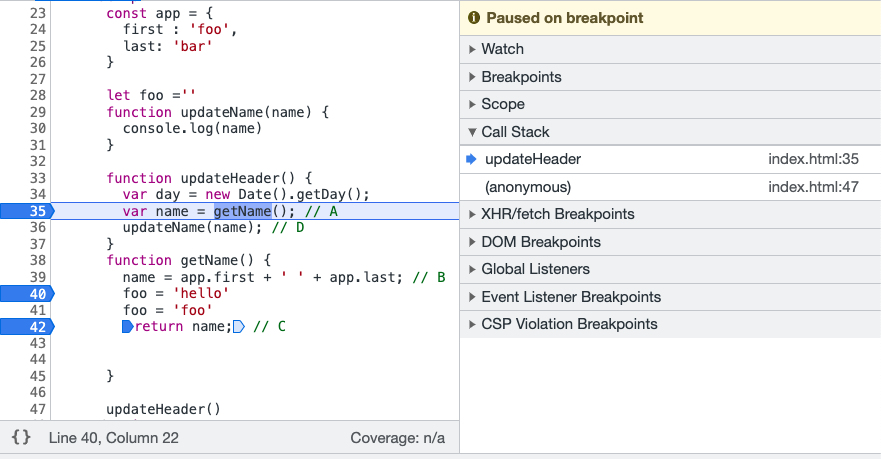
- Call Stack: StackTrace를 보여준다.
- XHR/Fetch BreakPoints : URL을 등록하여, fetch시 해당 로직 BreakPoint 등록
- Global Listeners / Event Listener BreakPoints
- 등록된 Global, Window, Document 이벤트 fire시, 해당 로직 BreakPoint 등록
React 개발자 도구
1. Components
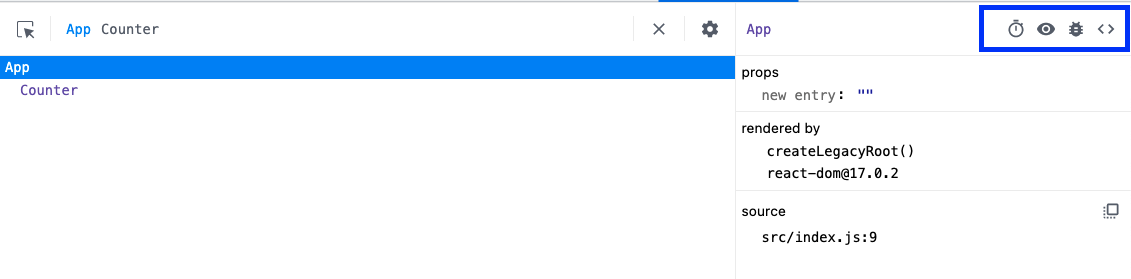
- Suspend
- 컴포넌트를 Suspend시켜, Fallback Component 여부를 확인할 수 있다.
- Inspect
- 컴포넌트가 어떤 HTML 태그를 렌더링 됬는지
Element태그로 이동하여 알려준다.
- 컴포넌트가 어떤 HTML 태그를 렌더링 됬는지
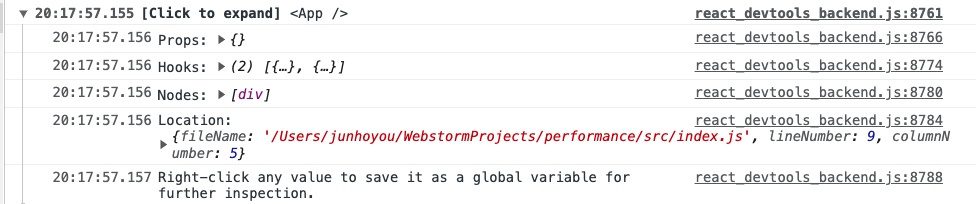
- Debugging
- 컴포넌트의 정보(props, state ...)를 console 태그에 알려준다.
- View Soure
- 해당 컴포넌트의 jsx 파일을
Sources탭으로 이동하여 보여준다.
- 해당 컴포넌트의 jsx 파일을
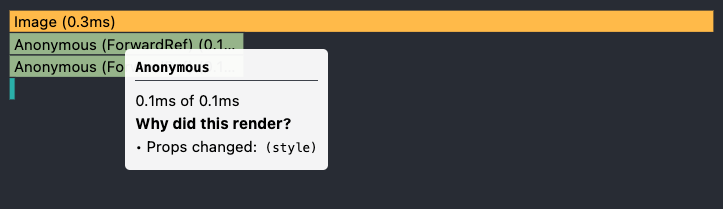
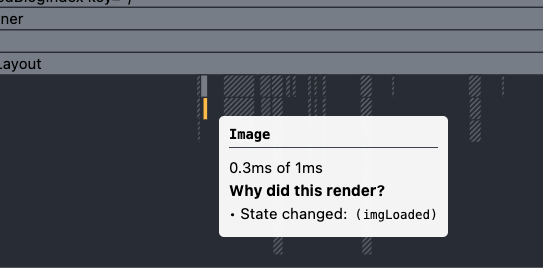
2. Profile
어플리케이션이 느리다? Profile 탭을 확인하자
- FlameGraph vs Ranked 차트를 확인하면서, 해당 컴포넌트가 왜 Render됬는지, 시간은 얼마나 걸리는지 확인할 수 있다.