0. Line을 그리기 전,
-
MockData
const data = [10, 12, 5, 10];
1. Path태그를 활용하여 선을 그려보자
-
path태그의d속성은 선을 어떻게 그리는지에 대한 정보 -
d속성의 5개의 명령어을 활용하여 path를string으로 표현- M(Move to = 점 이동) : M dx dy
- 초기 : 0, 0을 기준으로 해당 점으로 이동
- L(Line to = 라인 그리기) : L dx dy
- 해당점까지의 선을 그려준다.
- H(Horizontal = 수평선) H dx
- 해당 좌표에서 x만큼 수평선 그리기
- V(Vertical = 수직선
- 해당 좌표에서 y 만큼 수직선 그리기
- Z(Close path = 패스 닫기)
- 해당 좌표를 기준으로 가장 가까운 M을 찾아 연결시켜준다
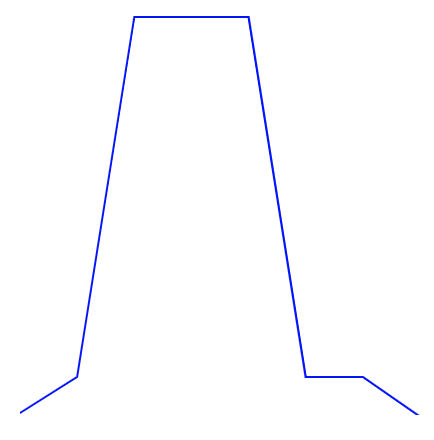
<svg class="line" width="400" height="400" stroke-width="2" stroke="blue" fill="none" ></svg> <script> const data = [10, 12, 5, 20, 50, 10, 100, 10, 50] const svg = document.querySelector('.line') const element = document.createElementNS( 'http://www.w3.org/2000/svg', 'path' ) let pathCoords = `M 0 ${data[0]},` data.forEach((d, i) => { pathCoords += `L ${i * 20} ${d},` }) element.setAttribute('d', pathCoords) svg.append(element) </script> - M(Move to = 점 이동) : M dx dy
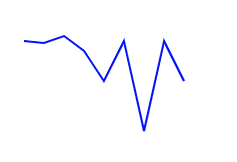
2. 만약? 이런 데이터가 들어온다면?
- 데이터는 항상 일정하게 들어오지 않을거다... 아마도... 100%
const data = [1234, 12345, 123445, 123445, 123445, 12345, 12345, 123]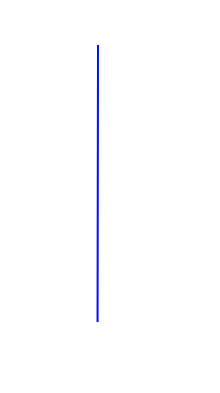
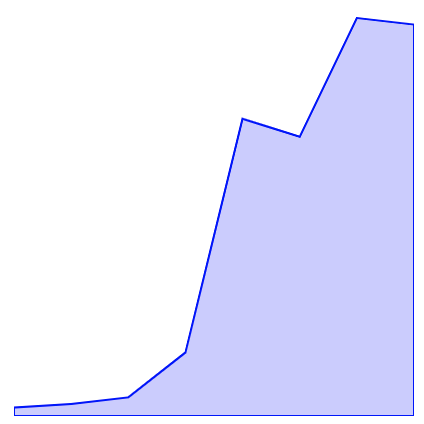
3. 비율에 따라서 X, Y를 계산 해줘야 한다!
-
X좌표 offset구하기
- SVG 넓이에서 들어온 데이터 길이만큼 나누며 ⇒ 하나의 데이터가 차지하는 x 좌표
-
Y좌표 offset 구하기
-
현재 값을 svg Height와 곱하여 최대 값(max value)으로 나누면, offset값을 얻을 수 있다.
-
Y의 좌표는 좌상단 0이기 때문에, Height에서 offset값을 빼주어 상대적인 위치를 구할 수 있다.
-
또한, stroke의 line이 svg Height를 넘어서면 보이지 않기 때문에, 그값을 offset 값에 더해준다.
// 차트가 그려질 viewport === viewbox
const width = parseFloat(svg.attributes.width.value)
const height = parseFloat(svg.attributes.height.value)

// X offset
const lastItemIndex = data.length - 1
const offset = width / lastItemIndex

// Y offset Function
function getY(max, height, diff, value) {
    return parseFloat(
        (height - (value * height) / max + diff).toFixed(2)
    )
}

// strokeWidth
const strokeWidth = parseFloat(svg.attributes['stroke-width'].value)

// math
const max = Math.max(...data)

// start Point Y
const pathY = getY(max, height, strokeWidth, data[0])
let pathCoords = `M 0 ${pathY},`

data.forEach((value, index) => {
    const x = index * offset
    const y = getY(max, height, strokeWidth, value)

    pathCoords += `L ${x} ${y},`
})

element.setAttribute('d', pathCoords)
svg.append(element)
-
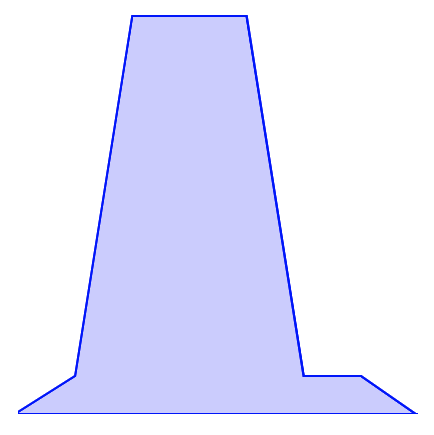
4. 차트 아래 부분을 채워보자
- fill 속성으로도 채워도 되지만, 차트가 꼬이면, 원하지 않는 결과가 나온다
- 기존의 경로를 활용하여 다각형을 만들어 색상을 채워주자.
//html
<svg class="line" width="400" height="400" stroke-width="2" stroke="blue" fill="rgba(0, 0, 255, .2)"></svg>  <span class="tooltip" hidden="true"></span>

//js
// fill을 none처리 하지않으면 선이 연결되어 색상이 칠해진다.
element.setAttribute("fill", "none");

// 라인을 그려주고, 비어있는 아래선을 그려주고 Z를 활용하여 만들어준다
const fillCoords = `${pathCoords} V ${height} L ${0} ${height} Z`

fill.setAttribute("d", fillCoords);
svg.appendChild(element);
svg.appendChild(fill)